Disability Employment and Marketplace in Boston and Other Top Metropolitan Areas
In the marketplace, people with disabilities—and their families, friends, and advocates—wield considerable spending power. This underrecognized market sector offers tremendous potential to the business community.
The Ruderman Family Foundation, in partnership with AIR and the Institute for Educational Leadership, created two research briefs that inform the business community in Boston and several other top metropolitan areas about the challenges faced by workers with disabilities and the contributions that those workers can make to the workforce.
In the first research brief, through an examination of 2017 American Community Survey data on working-age adults with disabilities ages 15 to 64, we quantify the pay gap between workers with and without disabilities in top 10 metropolitan areas in terms of population size. Despite historically forward-thinking state policies and antidiscrimination laws, the Boston metropolitan area (Boston Metro) shows greater disparities than other comparable metro areas in the United States.
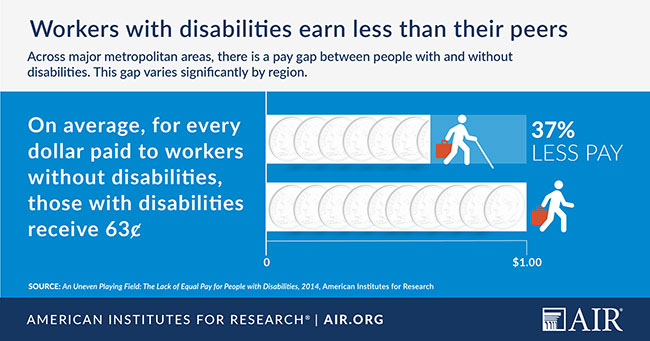
The income gap between people with and without disabilities in Boston Metro is about $24,000, which is almost $10,000 more than the U.S. average pay gap, while holding educational attainment constant. In other words, people with disabilities earn 63 cents to the dollar as compared to people without disabilities.
In the second brief, using the same ACS data, we quantify the amount of disposable and discretionary income held by people with disabilities and the implications for economic growth for the 10 largest metropolitan areas. The amount of disposable income (total income after taxes) represented by people with disabilities varies by metropolitan area, driven mostly by population size.
Boston has a relatively smaller market size with $7 billion aggregated disposable income, due to its smaller population size than larger metro areas such as New York and Los Angeles. However, in the context of the local economy of Boston, the sum of disposable income possessed by the disability community in Boston exceeds the annual budget for the City of Boston, which is $3.1 billion. This has important implications for economic growth in Boston, as spending will depend on accessible and inclusive places, products and services.