Measuring Up in Mathematics: What’s the Right Measure?
Last month, new reports from the National Assessment of Educational Progress (NAEP) presented two views of performance among 12th graders. The first, released May 7, shows a sharp contrast in the percentage of seniors judged proficient or advanced in reading and math. At grade 8, the percentage is virtually the same for both subject areas, but by 12th grade, many more students failed to hit the mark for math.
2013 NAEP Results: Percent Proficient or Advanced by Grade and Subject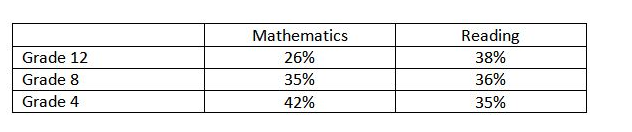
But NAEP’s proficiency levels may not tell the whole story.
New provisional estimates published May 14 by the National Assessment Governing Board, which oversees NAEP tests, look at the percentages of high school seniors who are academically prepared for college math and English. These results suggest a different story and show a greater agreement between the percentages of seniors who are prepared in math and reading.
Both views are based on thoughtful and well executed methodologies.
Broadly representative panels that include classroom teachers and members of the general public, as well as subject area specialists, set the three NAEP standards—Basic, Proficient, and Advanced—for students in 4th, 8th, and 12th grades. The standards are set separately for each grade and subject, and the Proficient level represents competency over challenging grade-appropriate subject matter and solid academic performance.
To set standards for college preparedness, the National Assessment Governing Board commissioned a series of research studies. Because NAEP does not track students over time, there is no direct evidence of how students who score at different levels on the NAEP scale fare in college. However, the researchers related NAEP to other tests (such as the SAT) that do have records of how their test takers perform in college. Using special arrangements that ensured student confidentiality, researchers were also able to examine the post-high school performance of NAEP test takers in one state. After the research was done, the Governing Board considered the body of evidence to determine the best NAEP score level in each subject area to serve as an indicator of preparedness. Here’s what they found:
2013 NAEP Results: Provisional Estimates of the Percent Academically Prepared for College
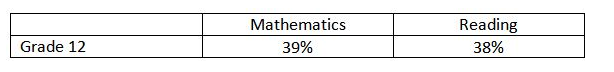
If only 26 percent of high school seniors are proficient in math, how can 39 percent be academically prepared for college?
The answer to this seeming paradox is likely that the standard setters had different goals. On the one hand, we want students to build a strong mathematics foundation before college so that they are motivated and prepared for success in challenging STEM careers. Poor K-12 mathematics preparation is a barrier to entry into these fields. On the other hand, it appears that many students do just fine, thank you, with a lower level of mathematics preparation.
The Common Core State Standards also represent high aspirations for math performance, and the designers of the Common Core believe they have found new ways to organize the math curriculum to help students achieve. As we begin to see results for students schooled under the Common Core State Standards, it will be interesting to see whether achievement results for 12th grade students start to show a different pattern. Until achievement results for 12th grade students with a good dose of Common-Core-based education under their belts become available (several years into the future), educators who set NAEP standards may have to consider just what our national standard of math proficiency should be.