Indicators of School Crime and Safety
Explore the full reports and the infographics we developed from them.
The purpose of this project is to plan, research, design, and execute the annual Indicators of School Crime and Safety, a flagship report co-sponsored by the National Center for Education Statistics and the Bureau of Justice Statistics. Since 2000, AIR has maintained lead authorship of the 23-indicator report, the Department of Education’s only annual publication on the status and trends of crime and safety in U.S. schools.
The 2022 report draws on data from 11 surveys supported by various offices of the federal government. It covers topics including student and teacher victimization, bullying, weapons and drugs, disciplinary problems, safety and security measures, mental health services, and postsecondary crimes. Using their content area expertise in these topics, AIR authors tabulated and presented summary statistics to inform the nation about current aspects of crime and safety in K-16 schools.
Infographics
Browse our infographics on a number of topics from the reports over the years.
2022
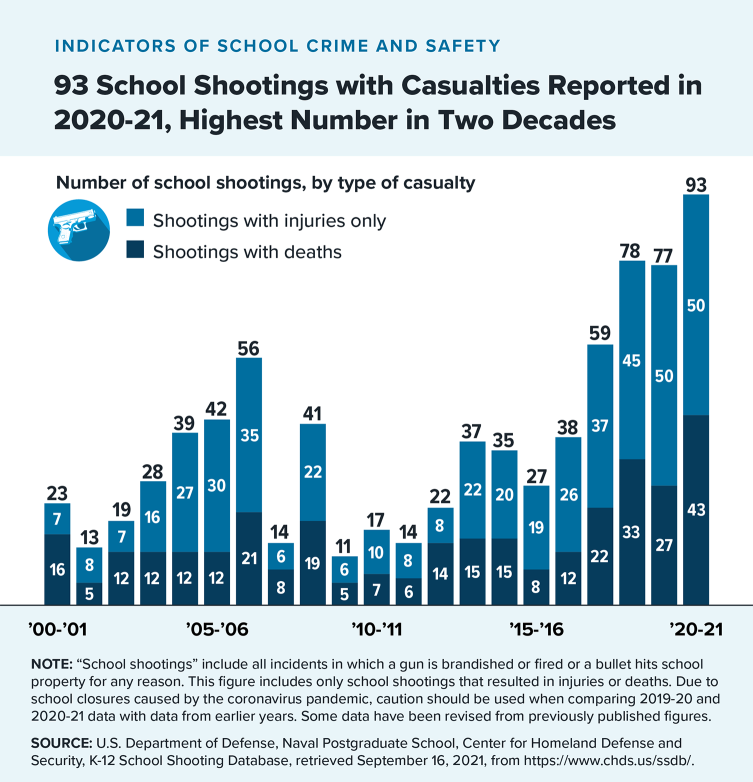
School Shootings
School shootings have reached the highest number in decades, according to the recent Indicators of School Crime and Safety report (2022).
2018
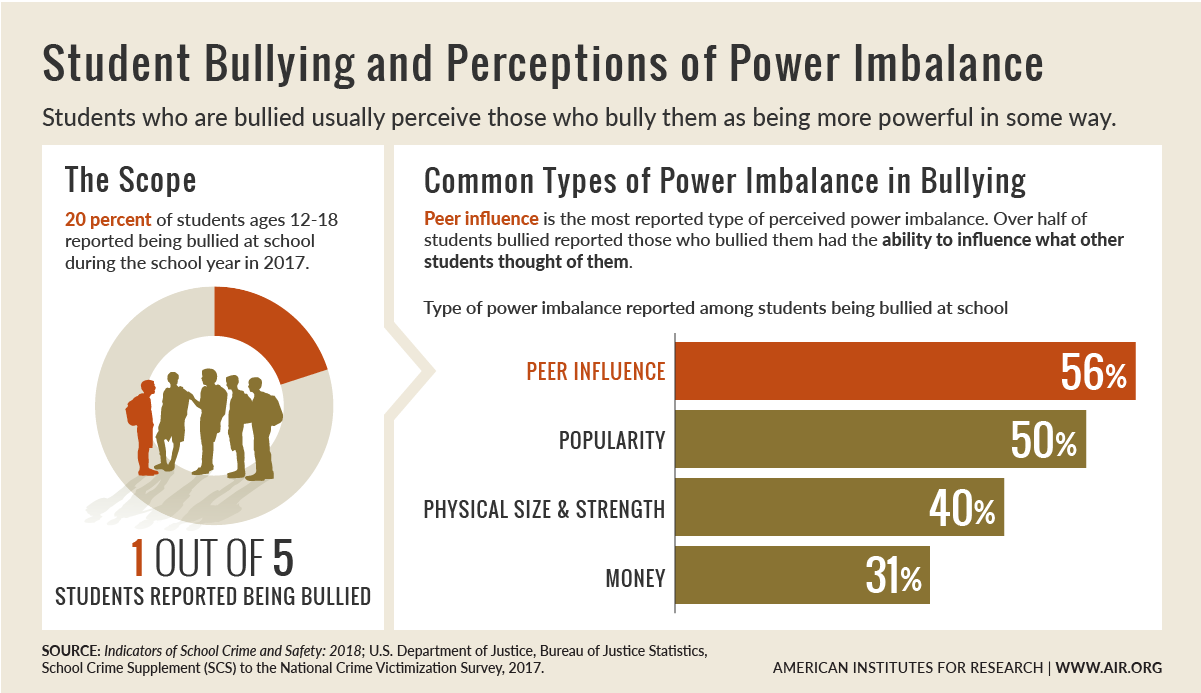
Bullying
Bullying is prevalent and often has significant negative effects on individuals, families, and schools, according to a Spotlight on school bullying authored by AIR in the 2018 report.
2016
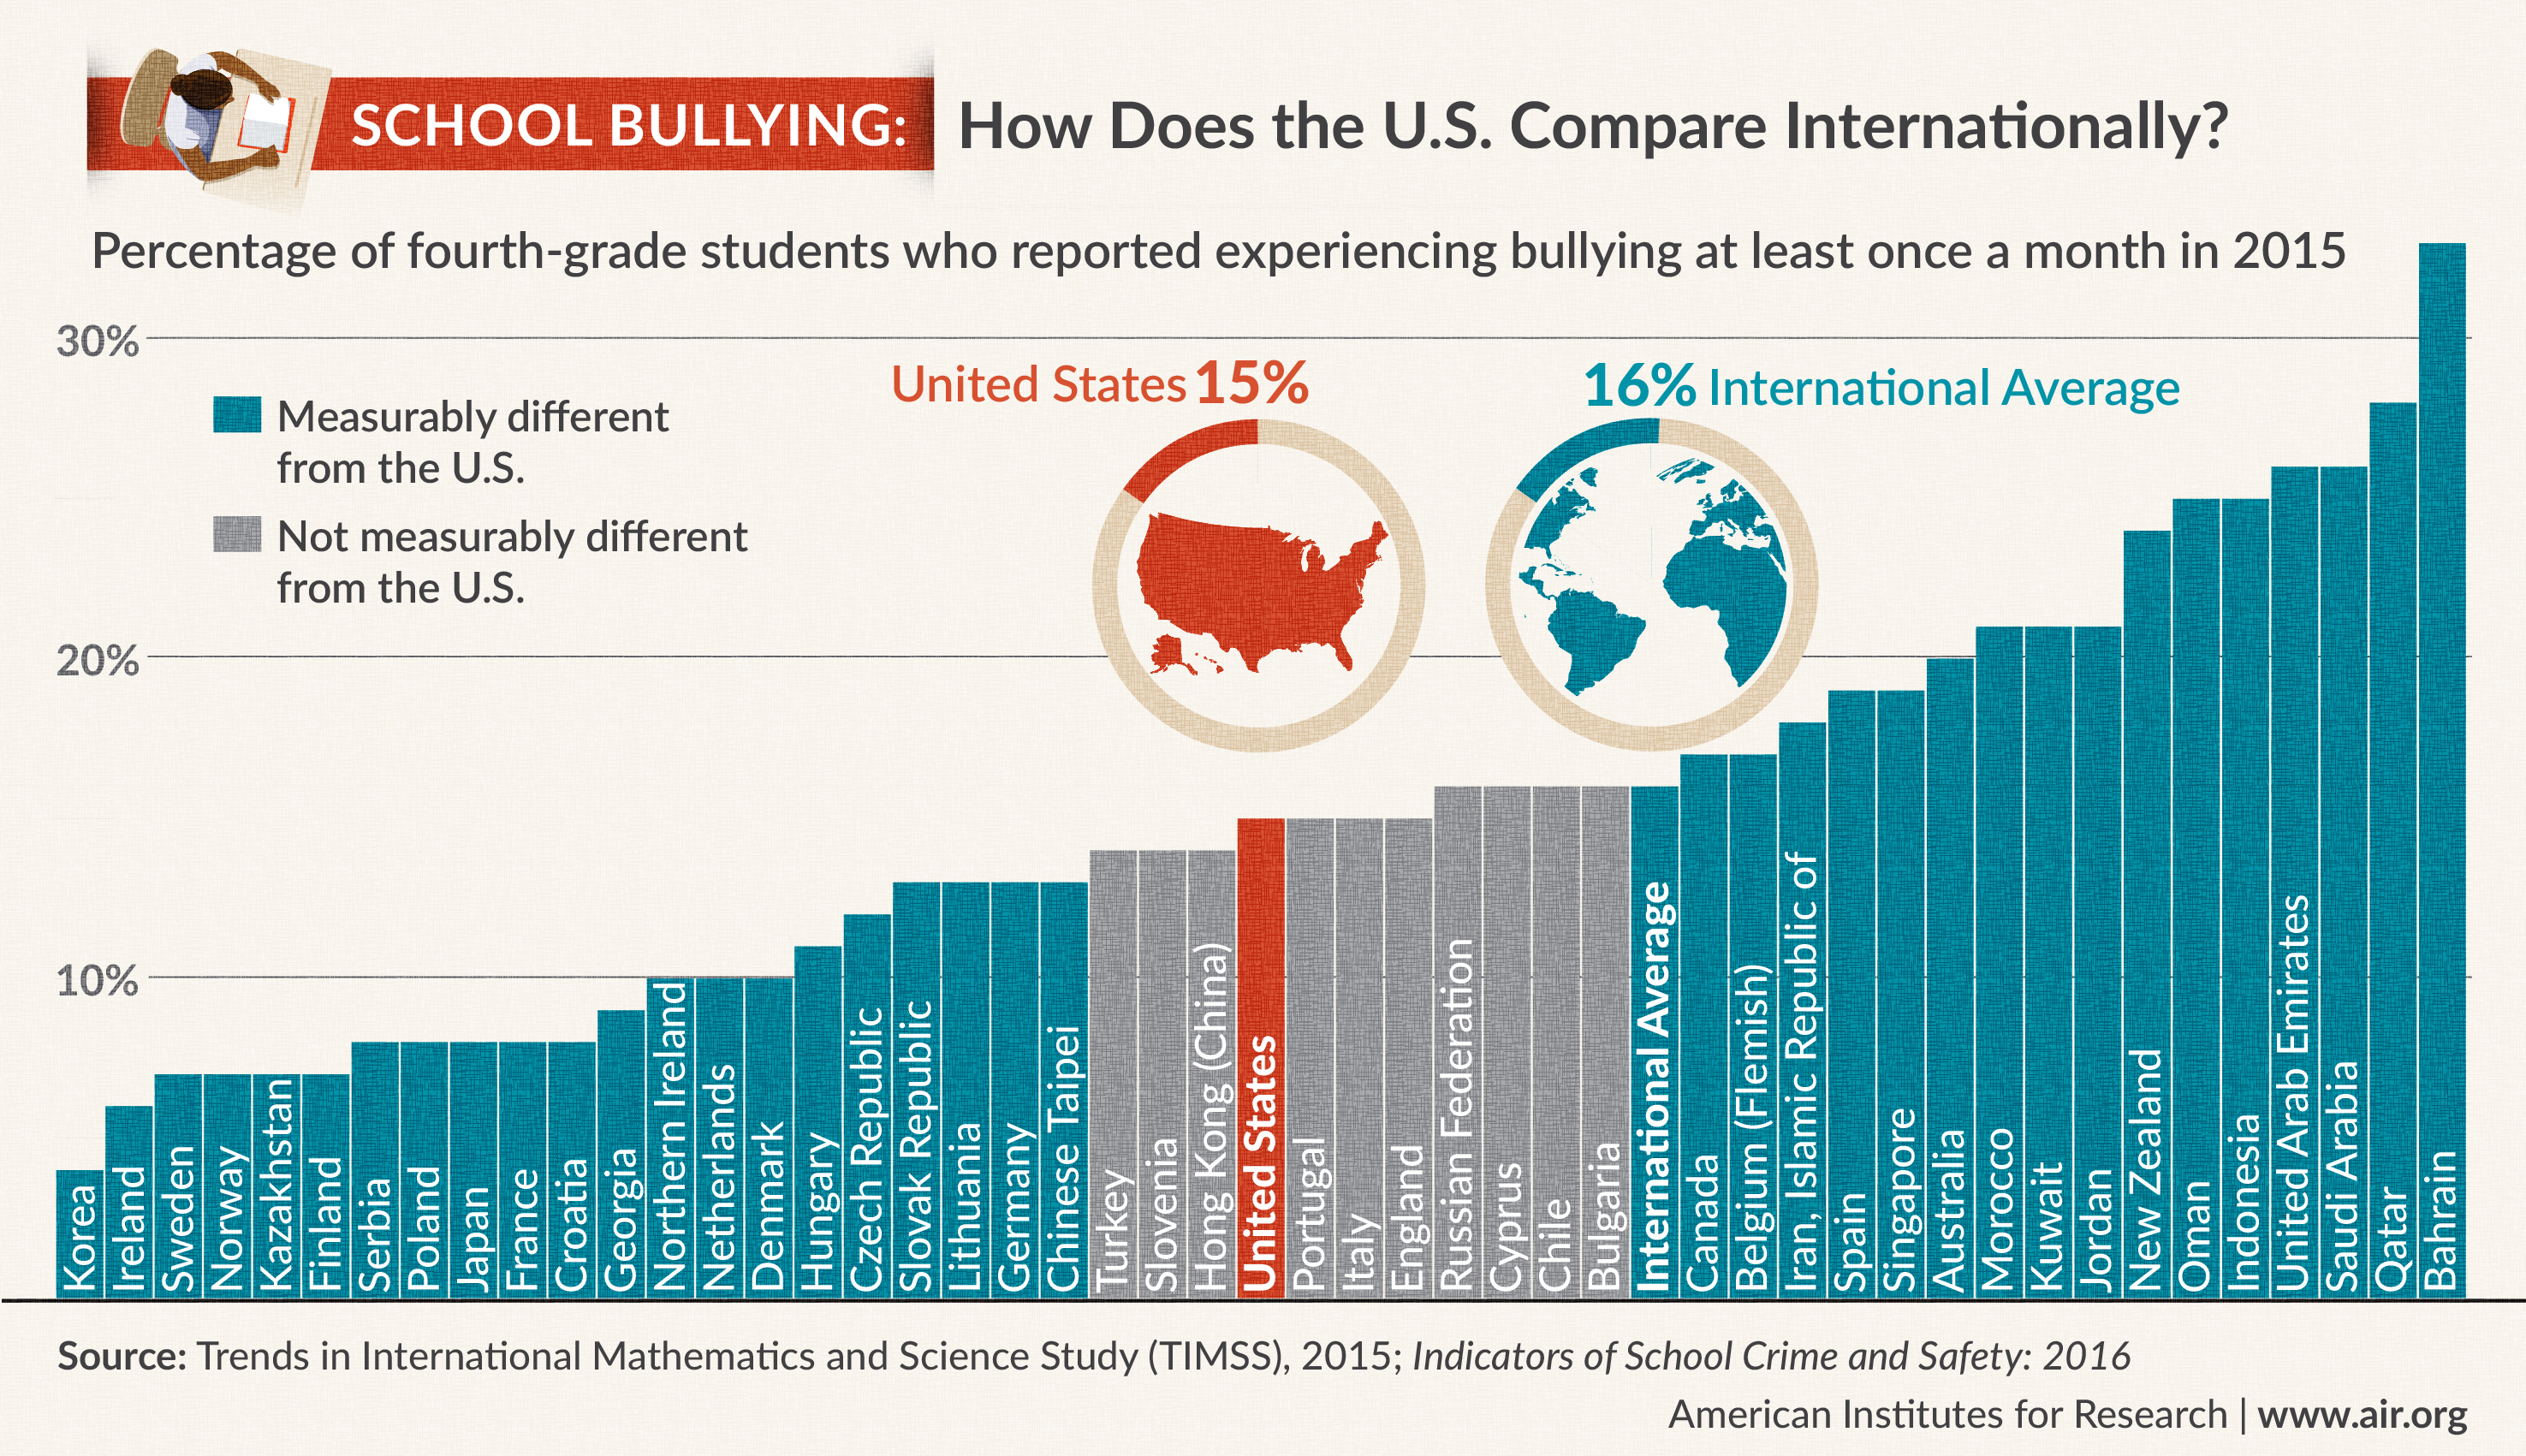
Bullying
In 2015, about 15 percent of U.S. fourth-graders and 7 percent of U.S. eighth-graders reported experiencing bullying at least once a month. These percentages were lower than the international averages of 16 and 8 percent.
2015
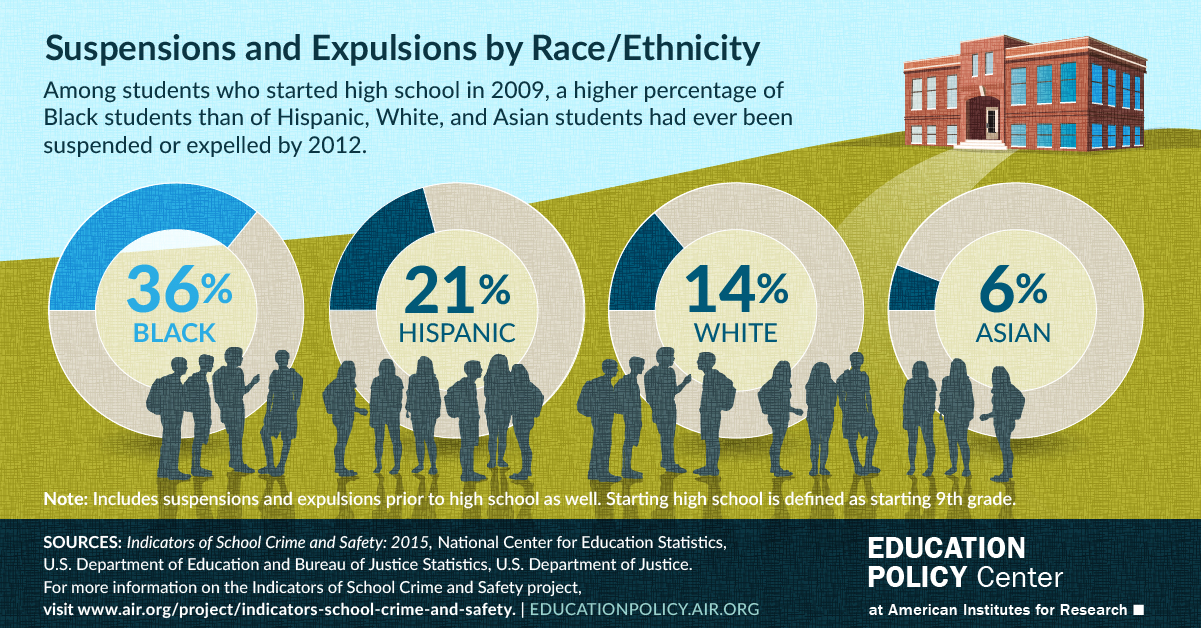
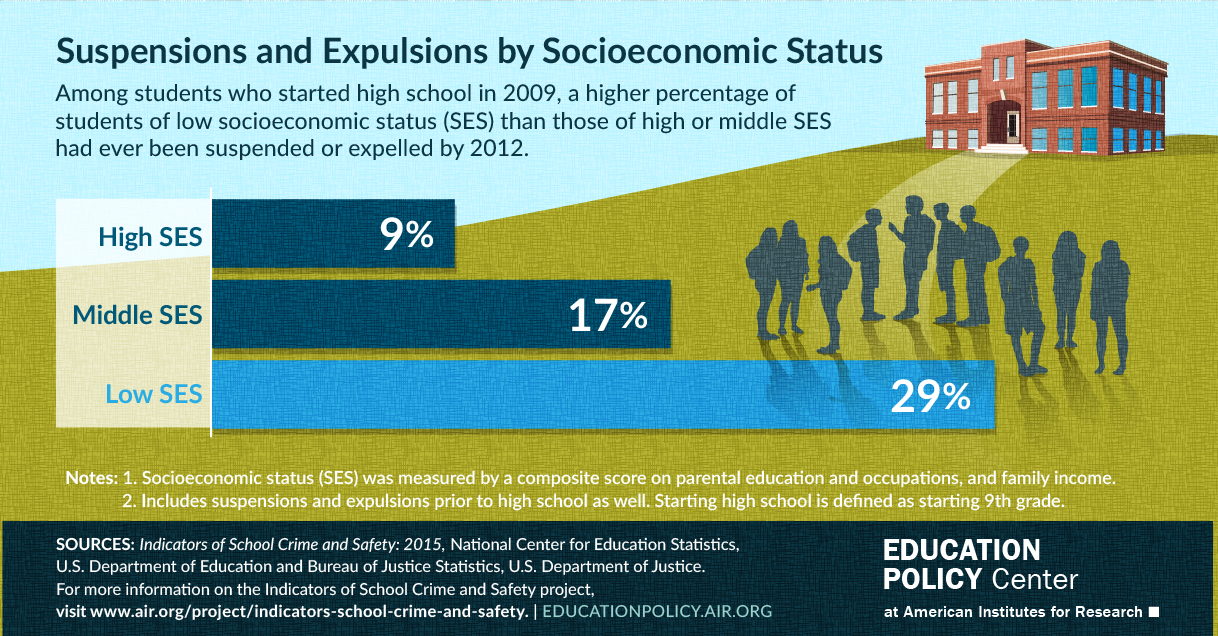
Suspensions and Expulsions
New this year were two “spotlight indicators,” one on topics related to student suspension and expulsion and another on juvenile offenders in residential placement facilities. Additional topics covered include student and teacher victimization, crime at school, disciplinary actions taken by schools, school security measures and criminal incidents at postsecondary institutions.
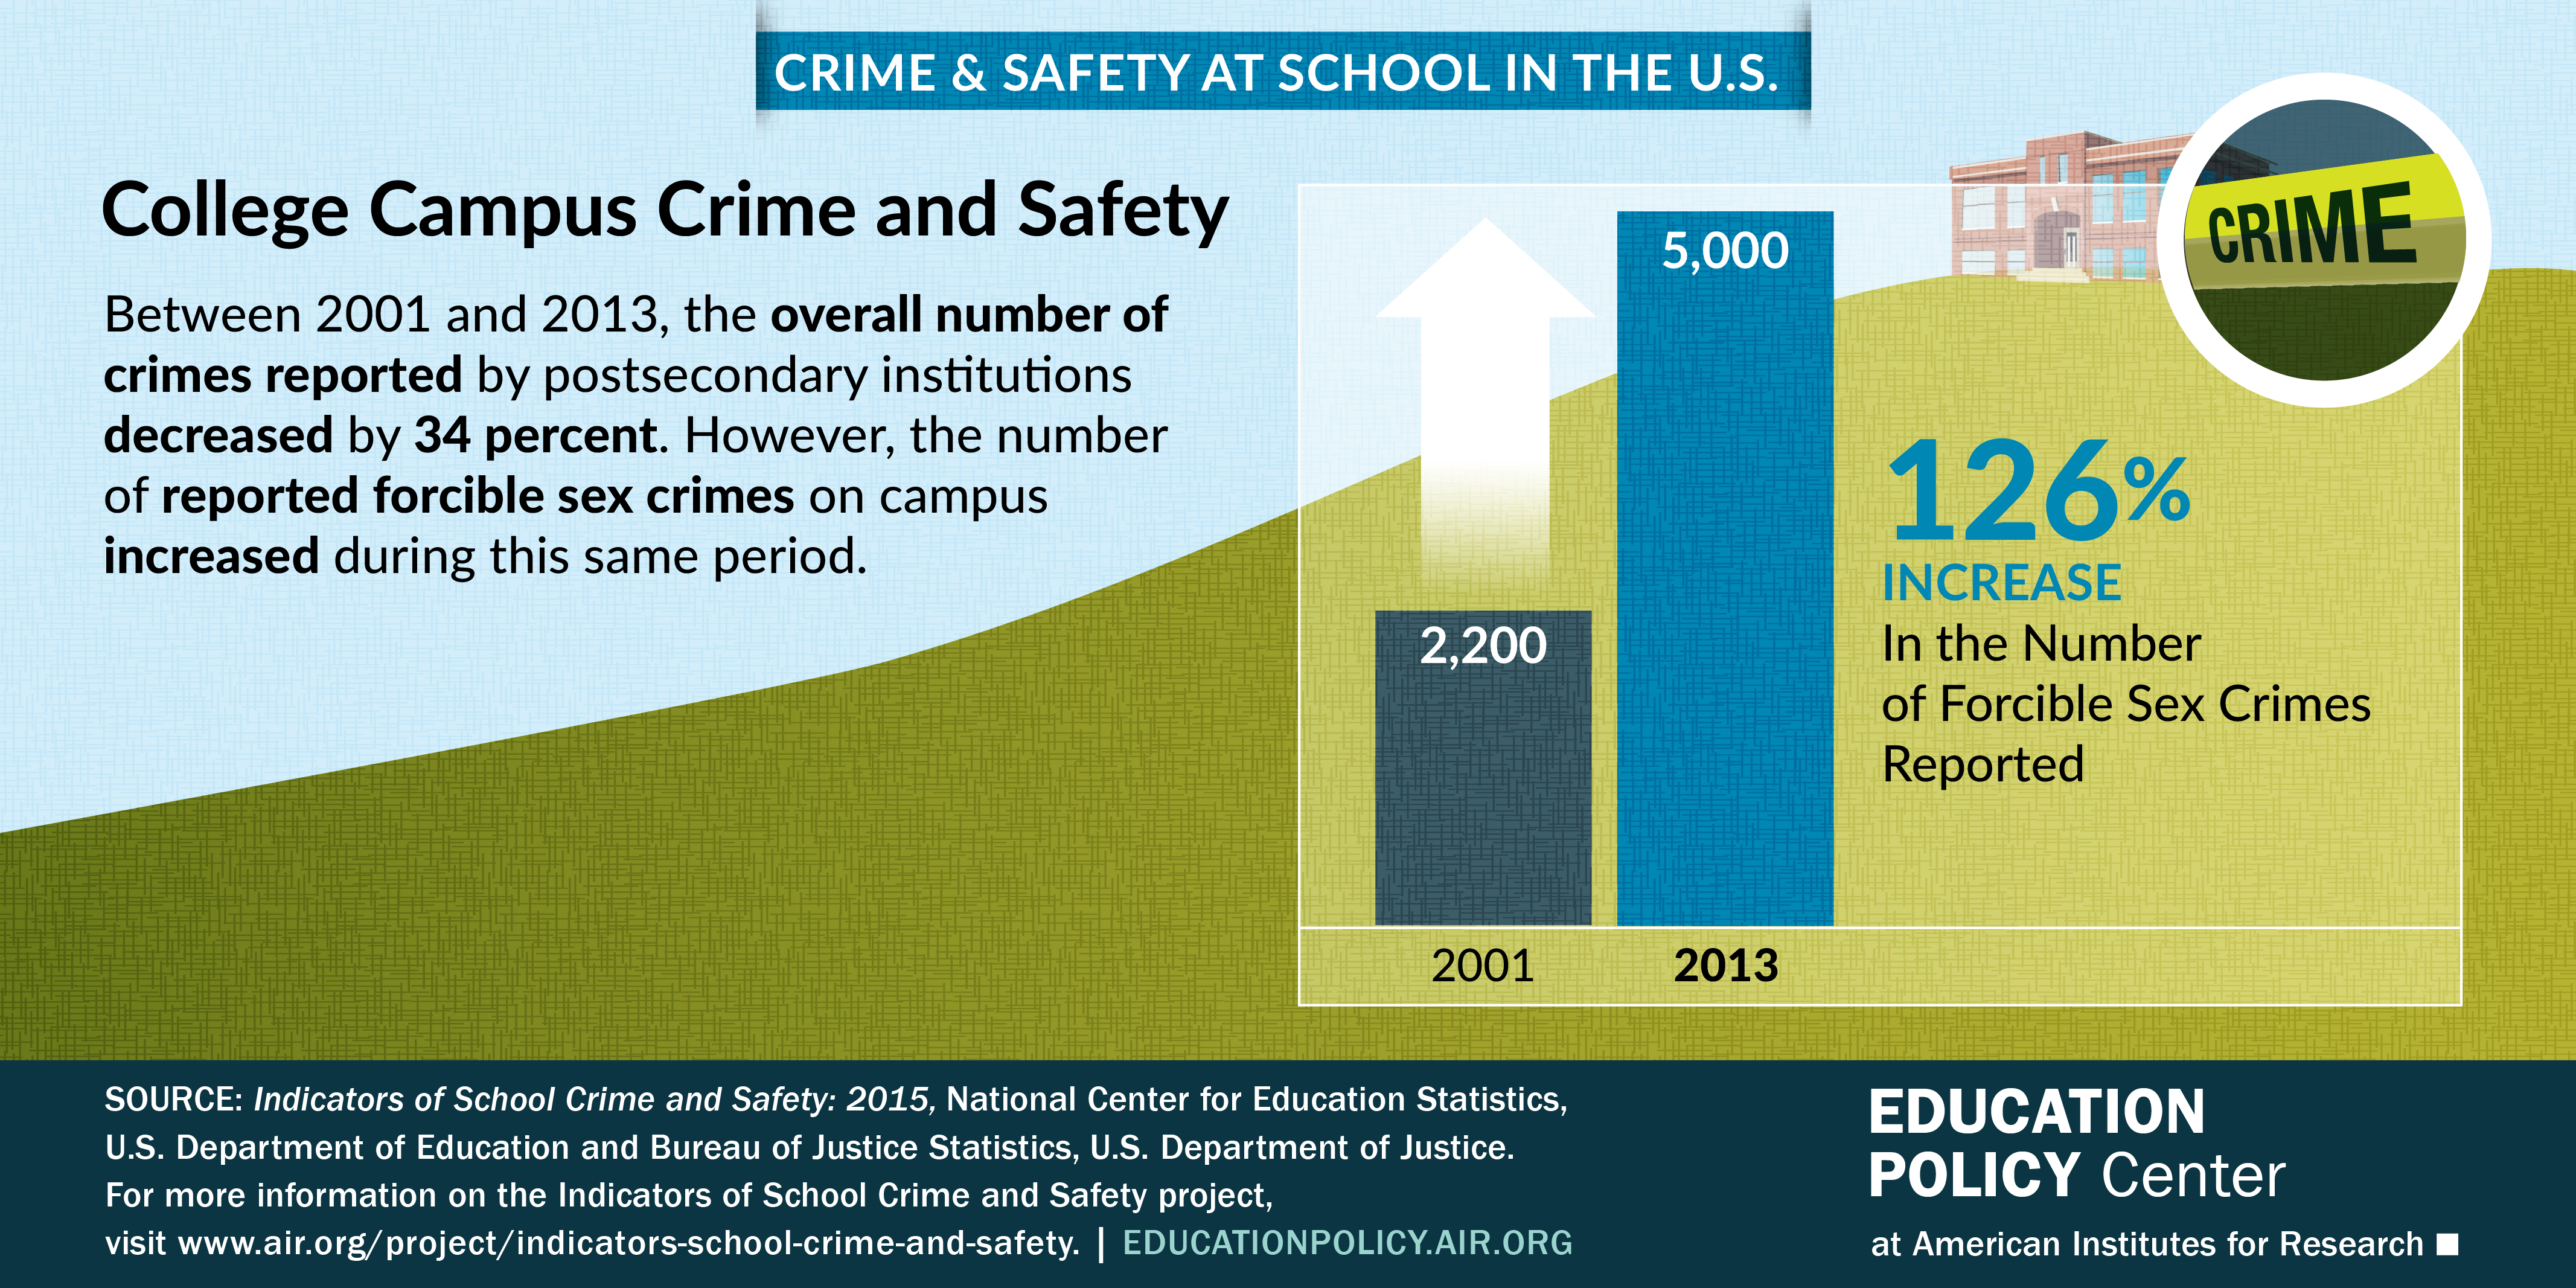
Crime and Safety on Campus
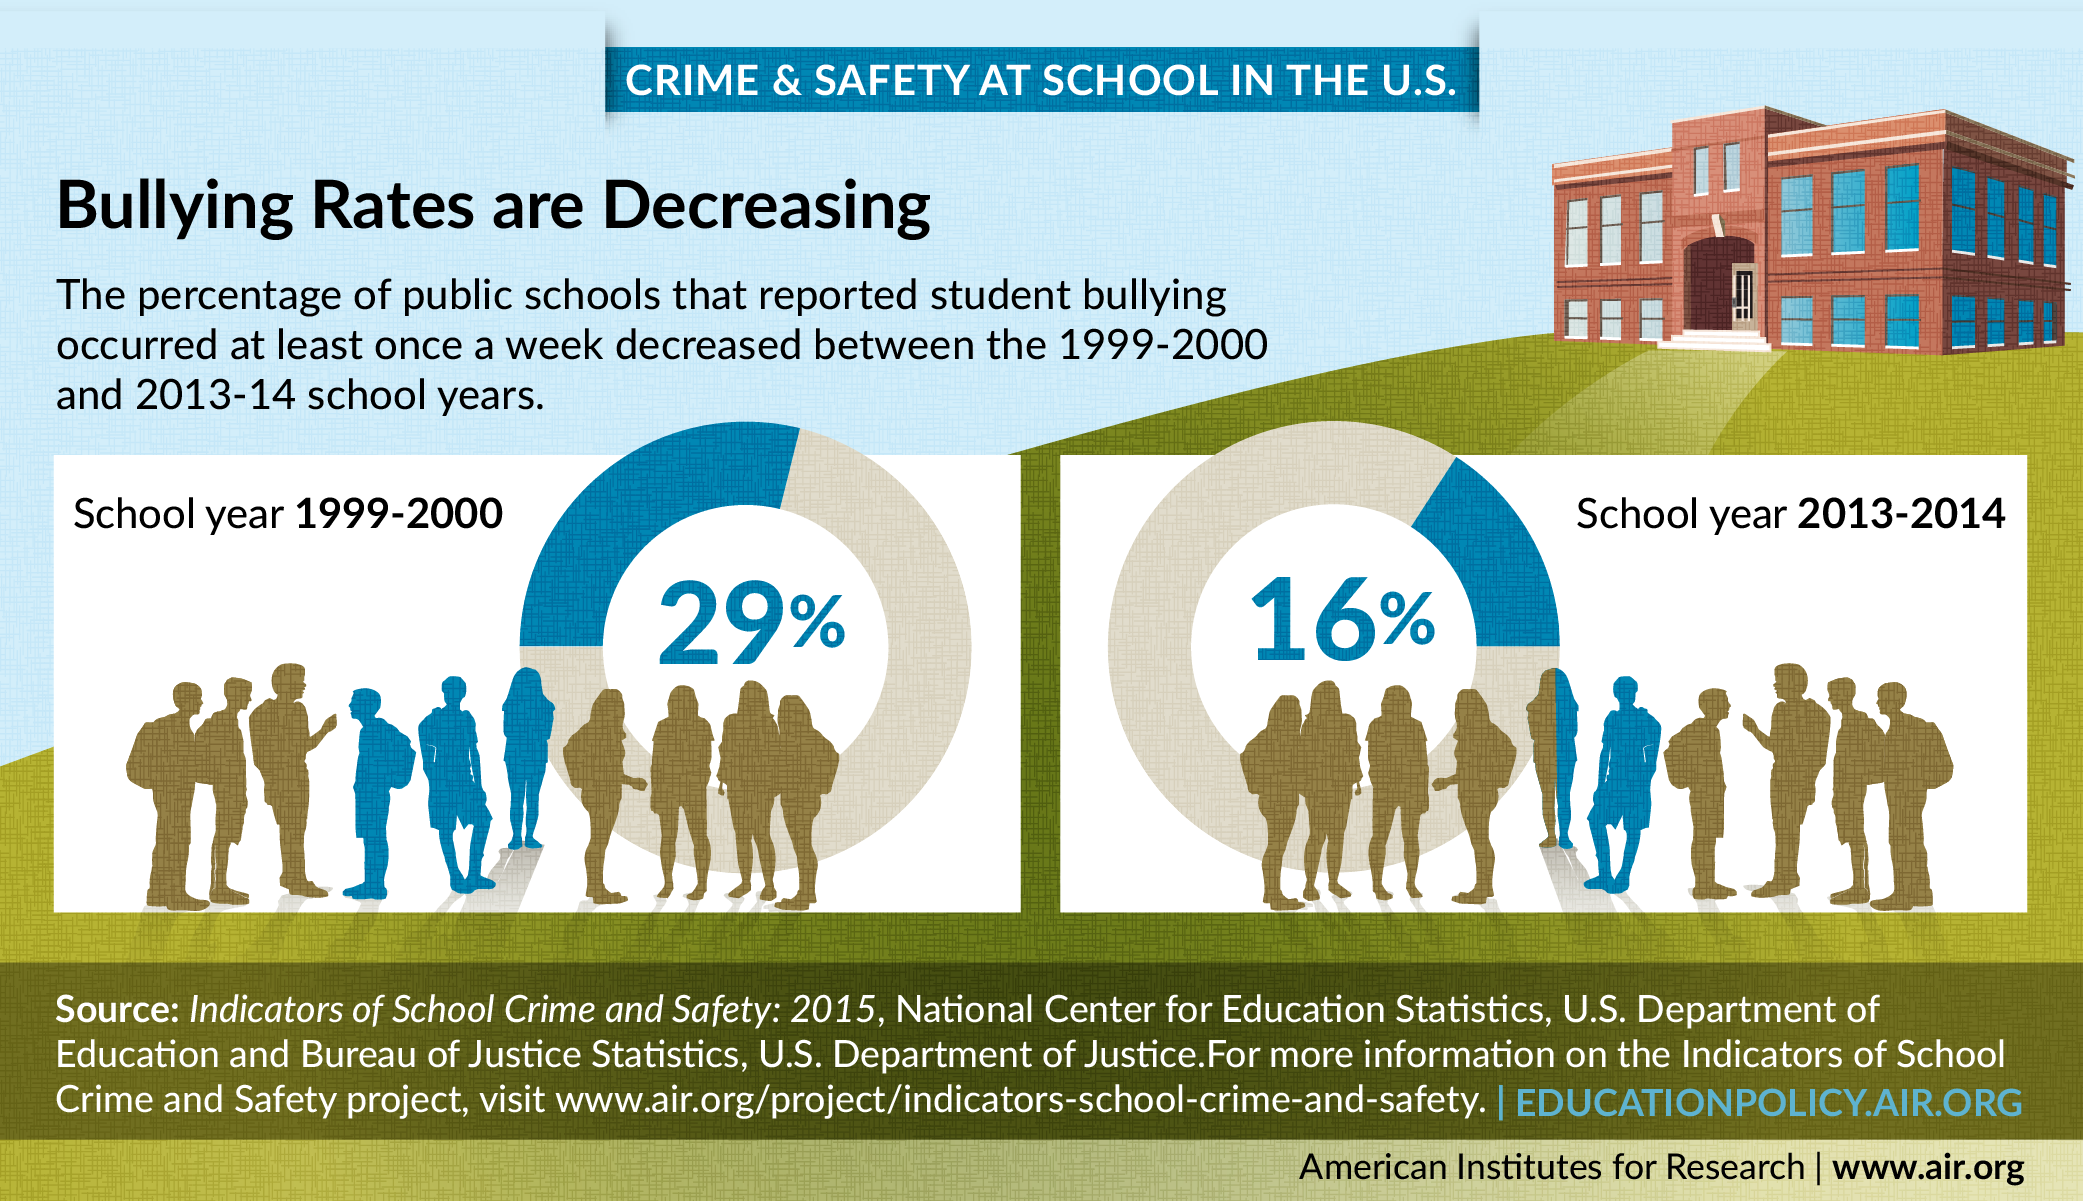
Bullying
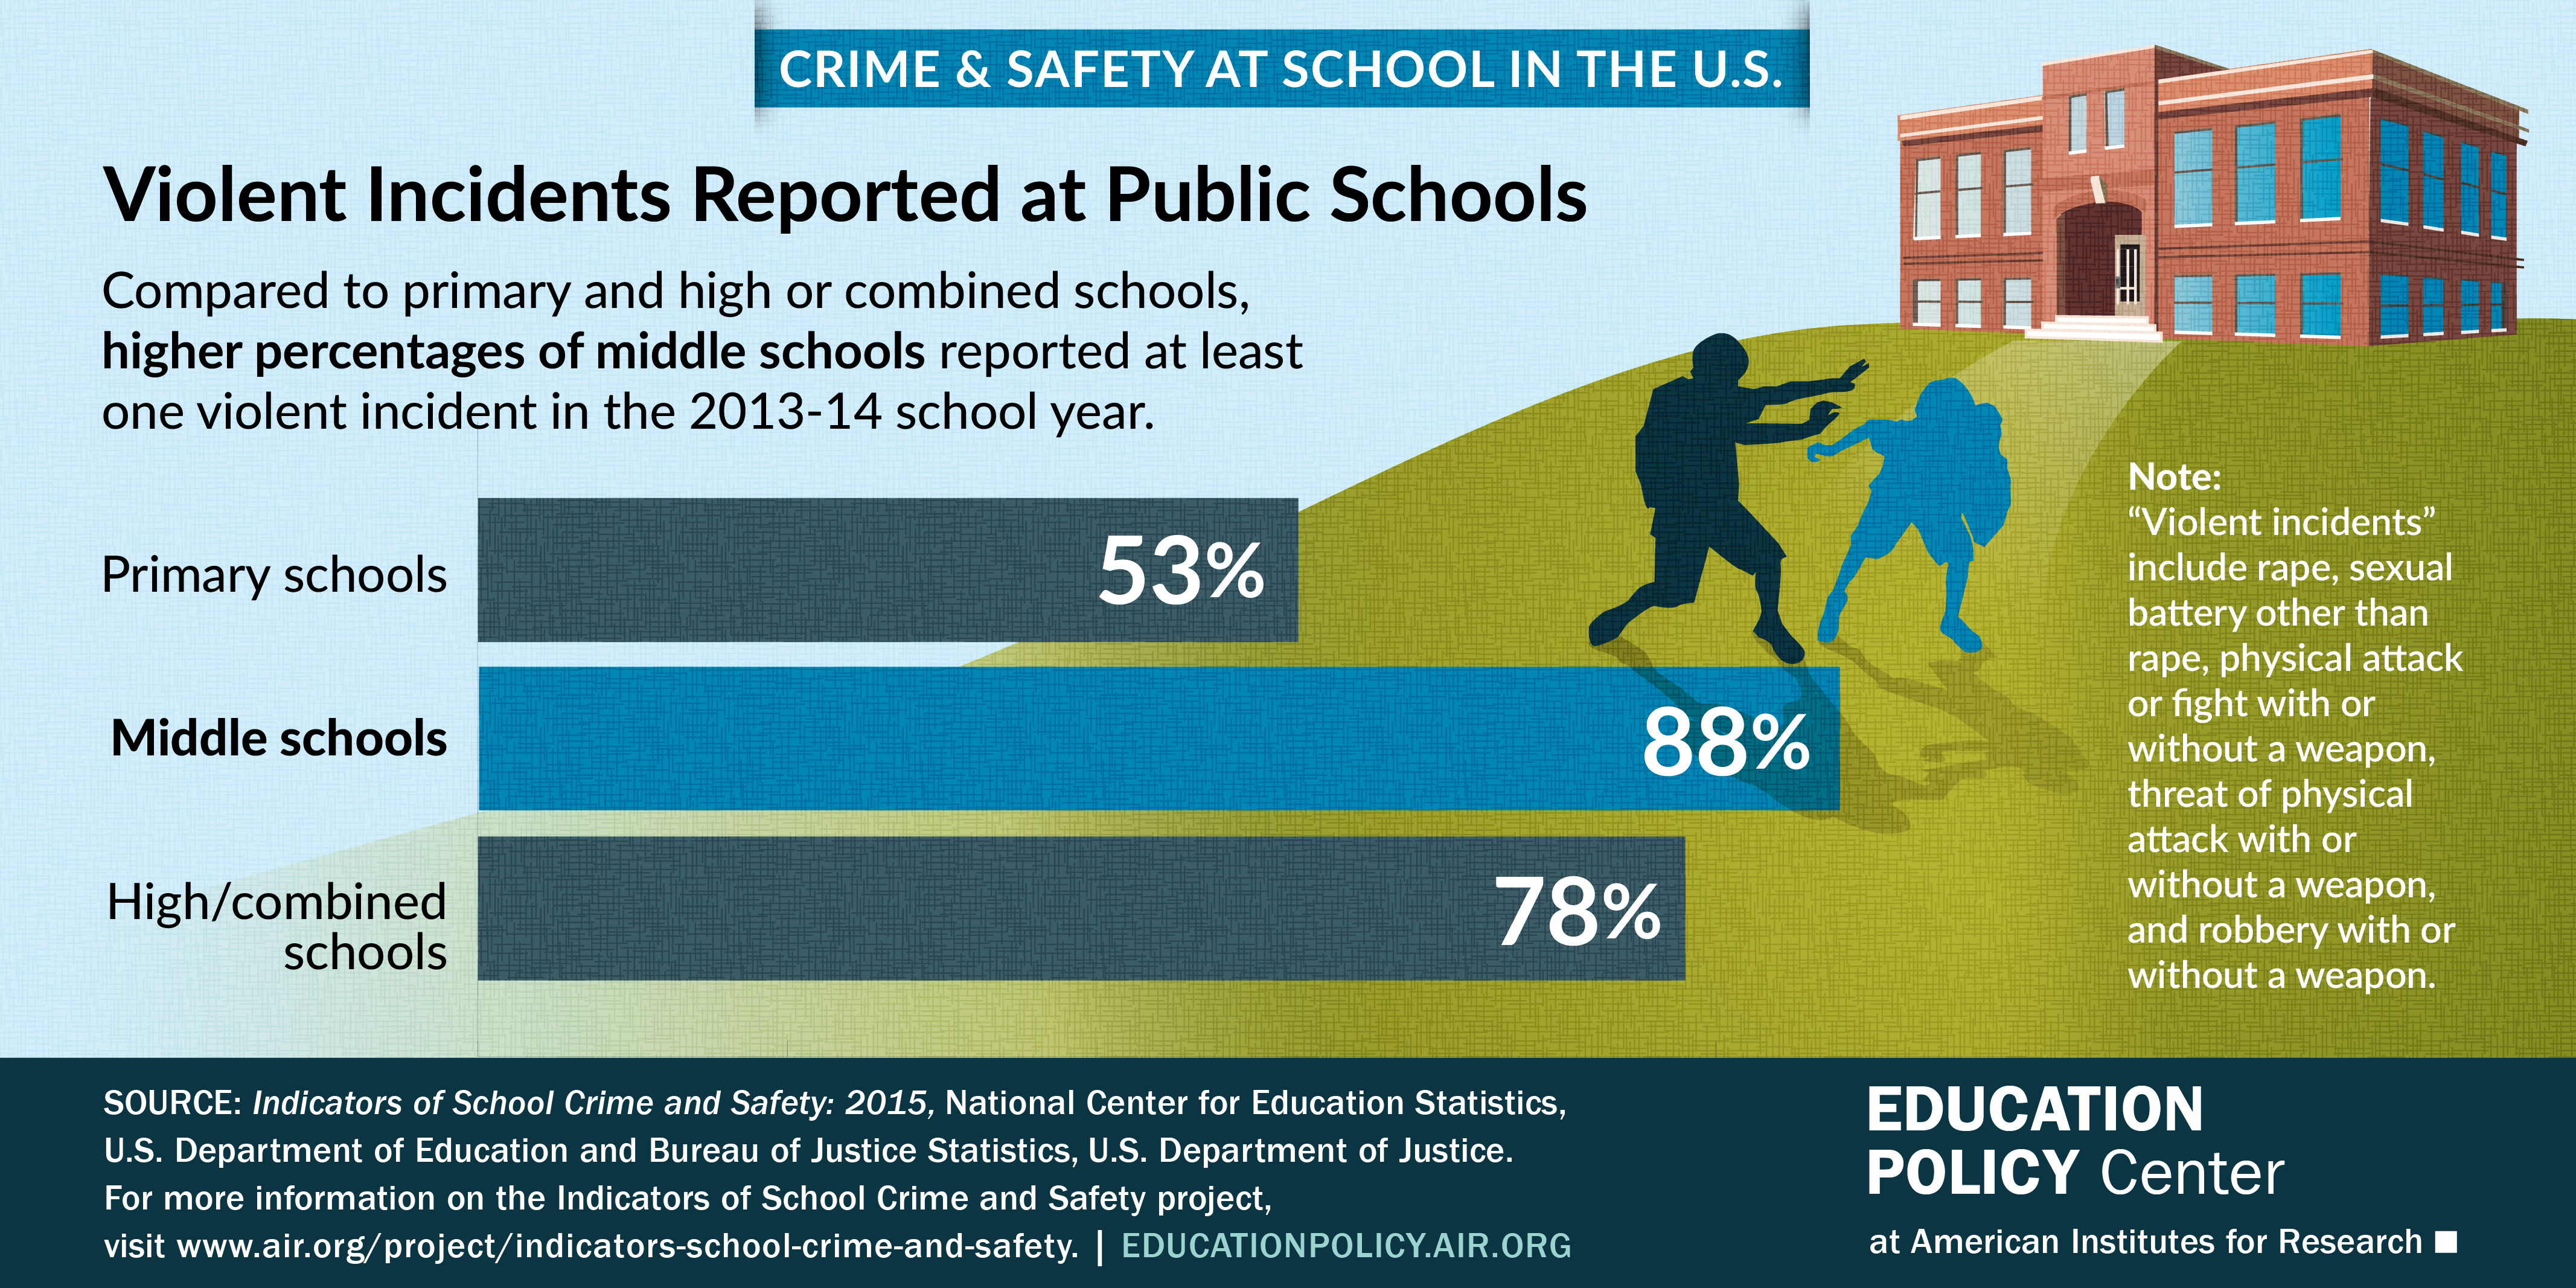
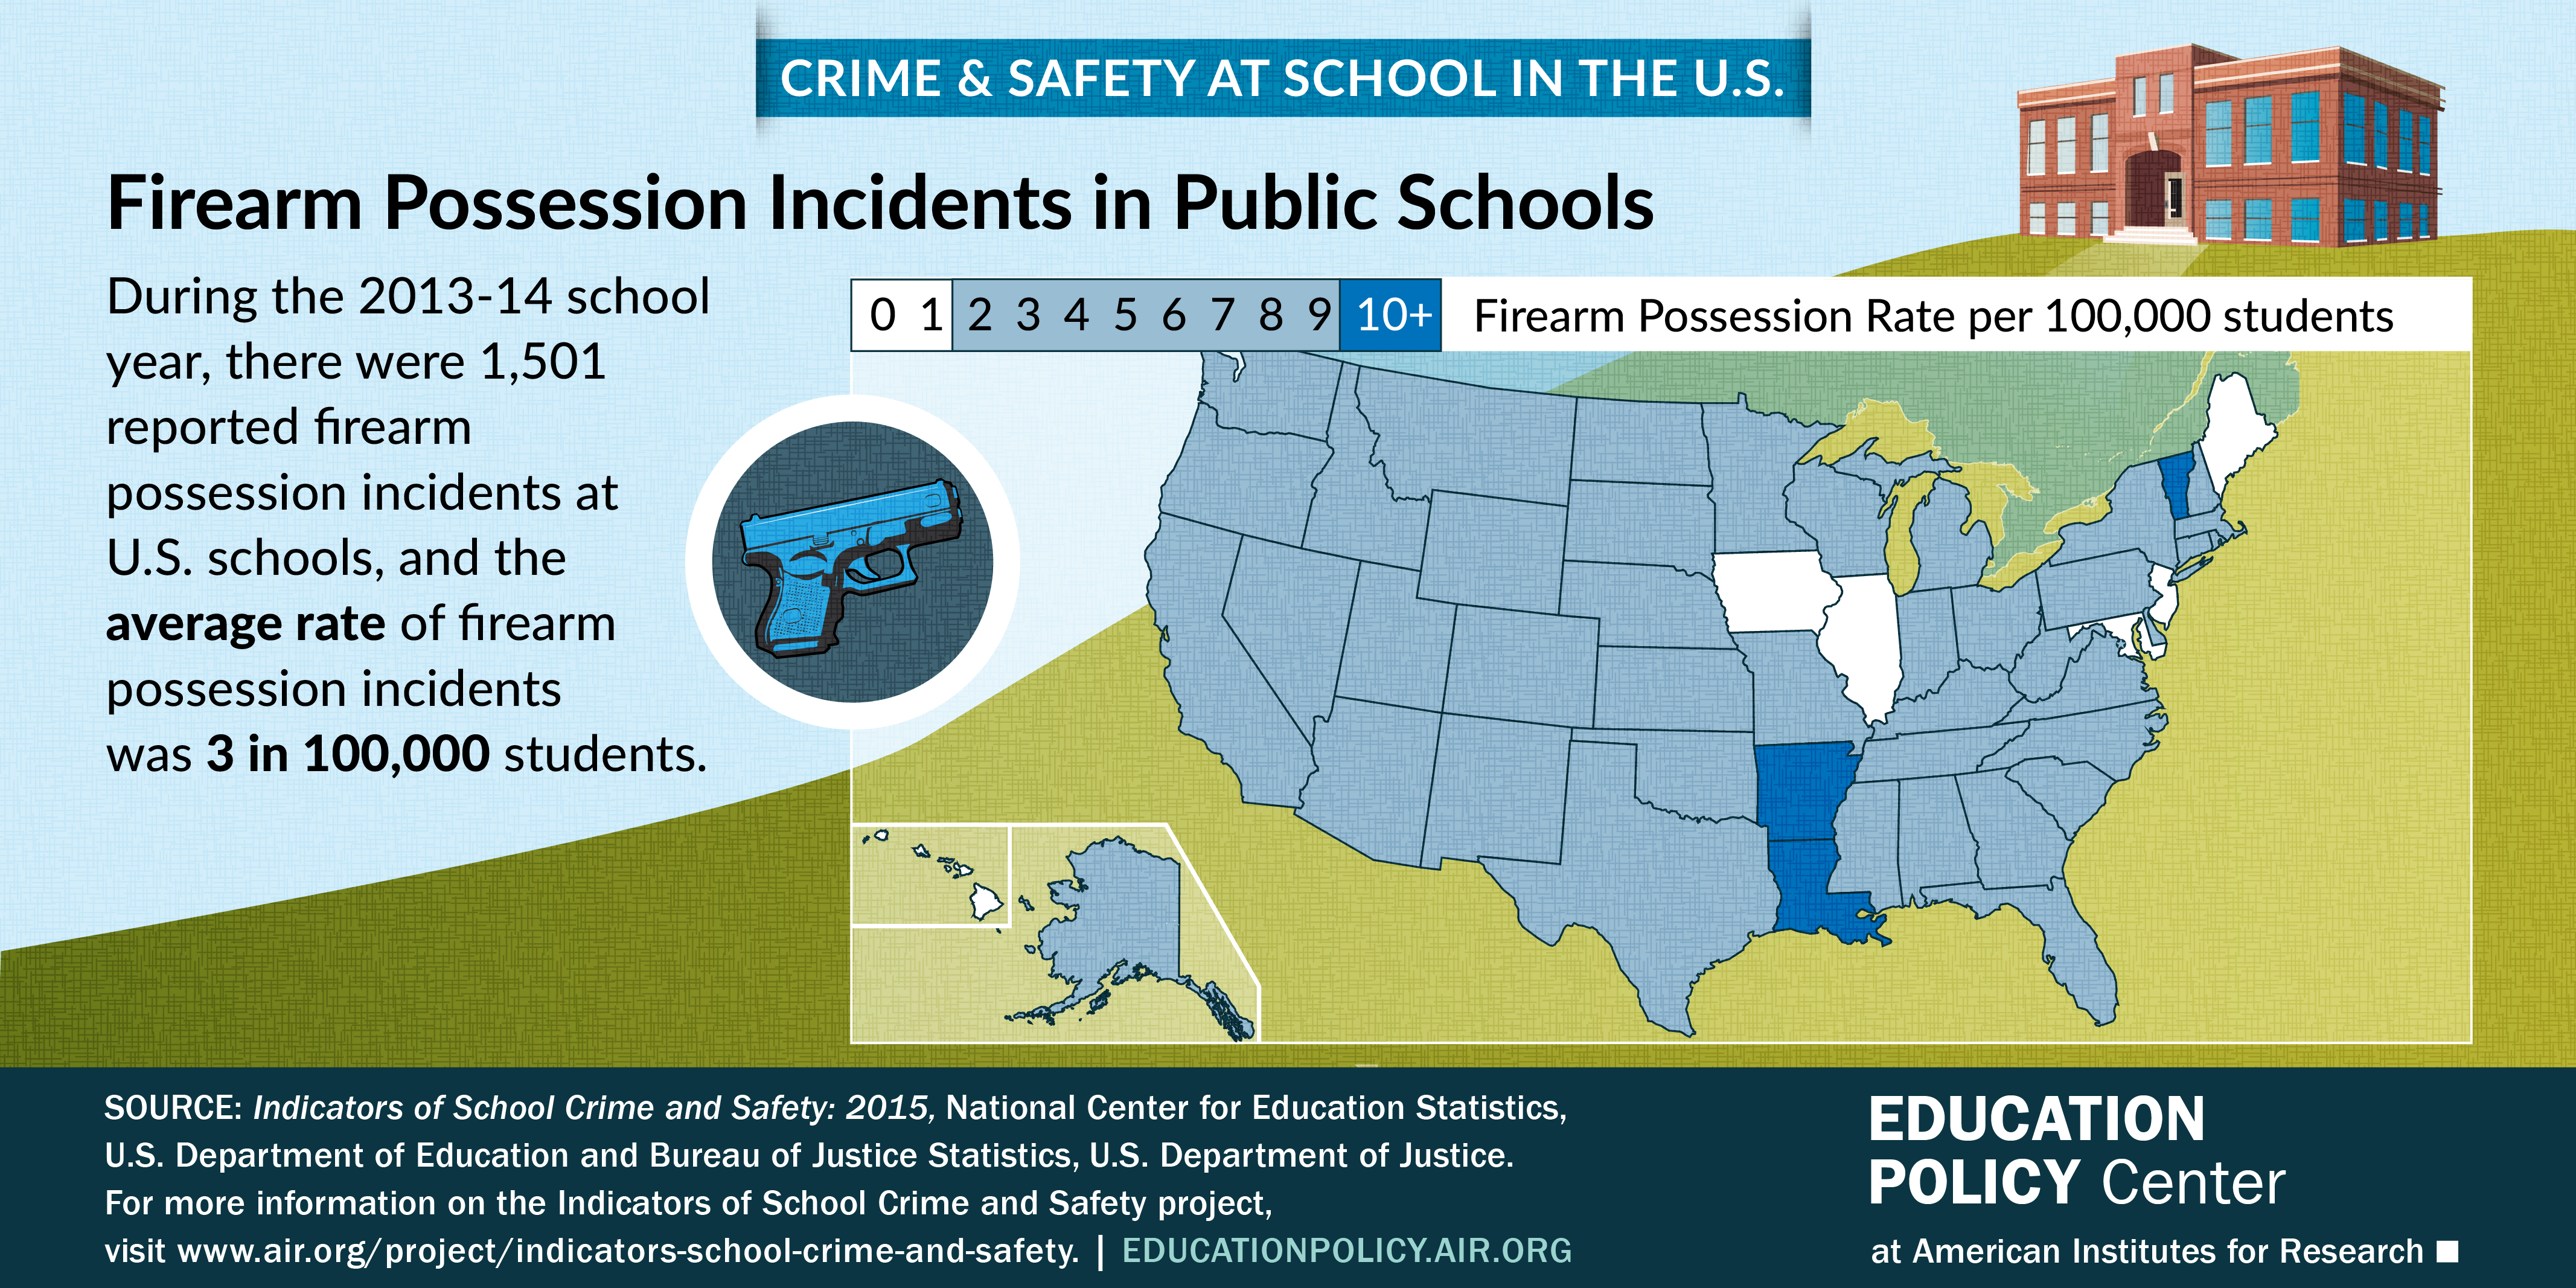
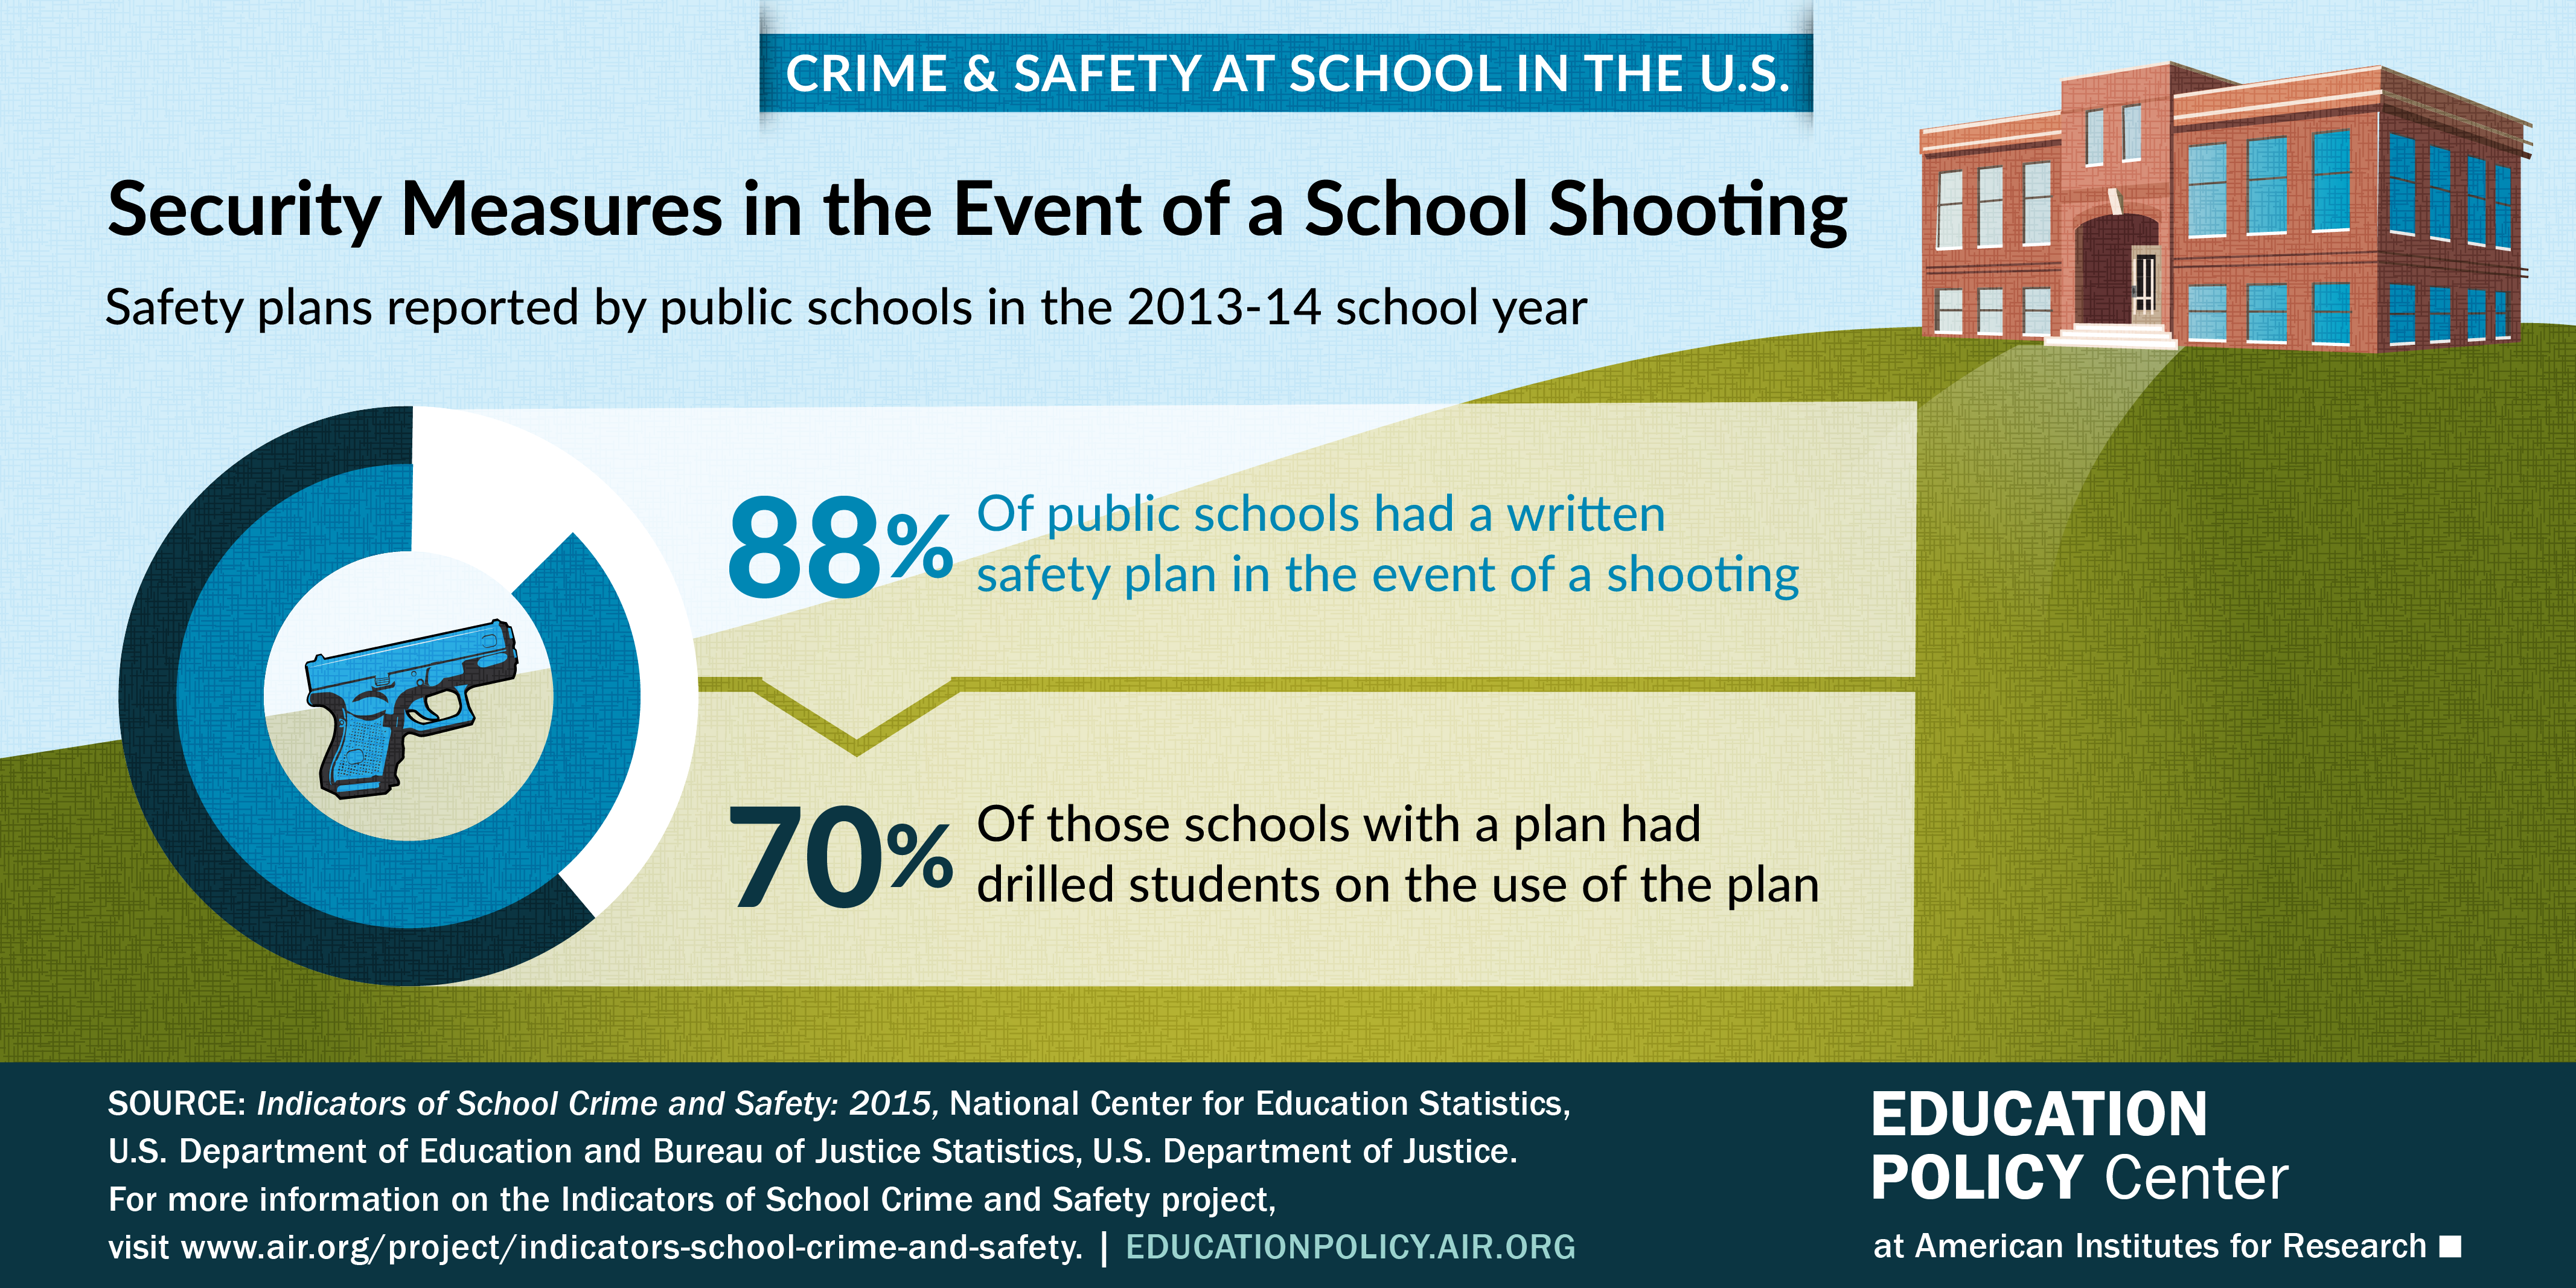
Violence at Public Schools
2014
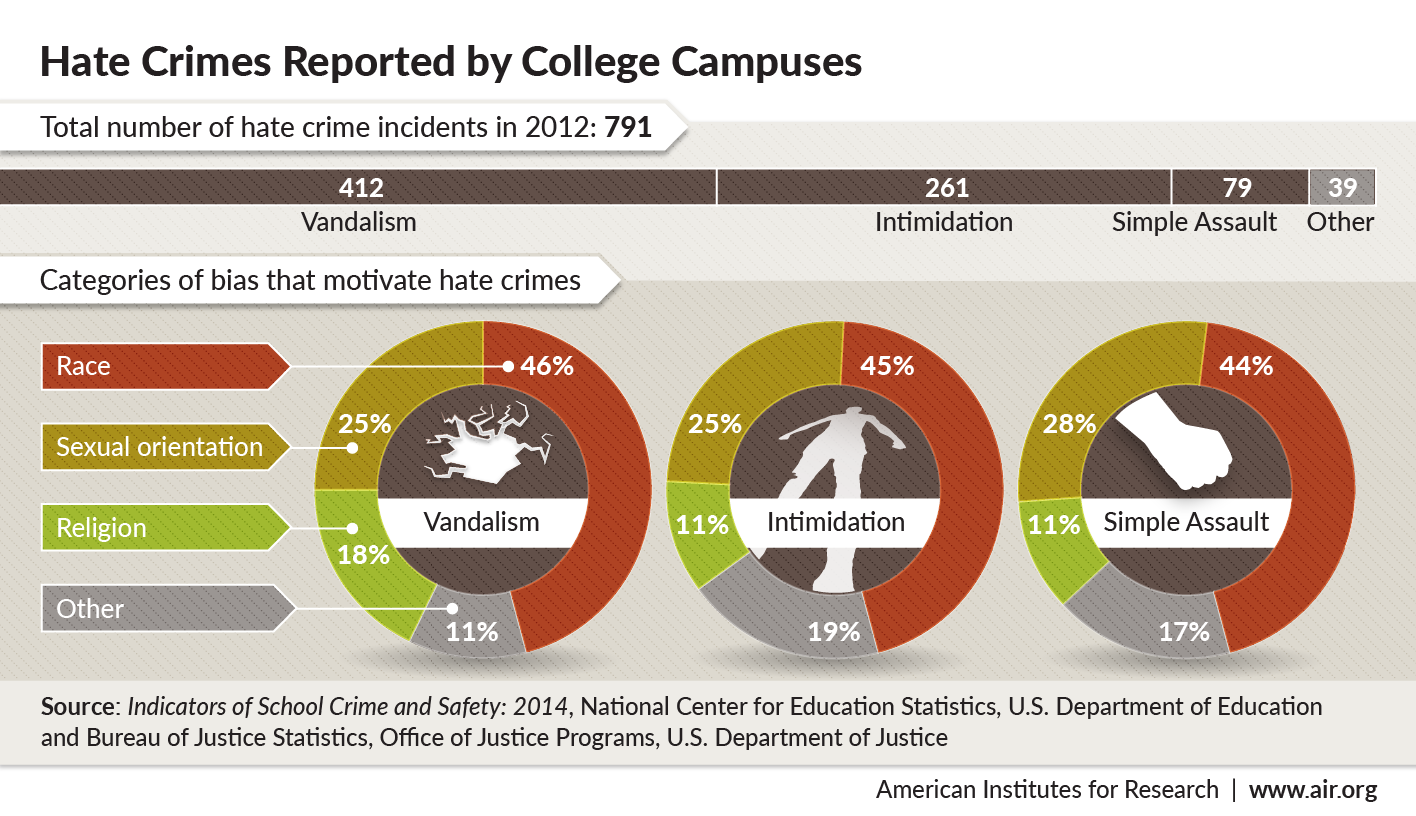
Hate Crimes on College Campuses
The 2015 report included a new section on college hate crimes, many of them involving race or sexual orientation; this infographic breaks down those crimes by categories of bias.
2013
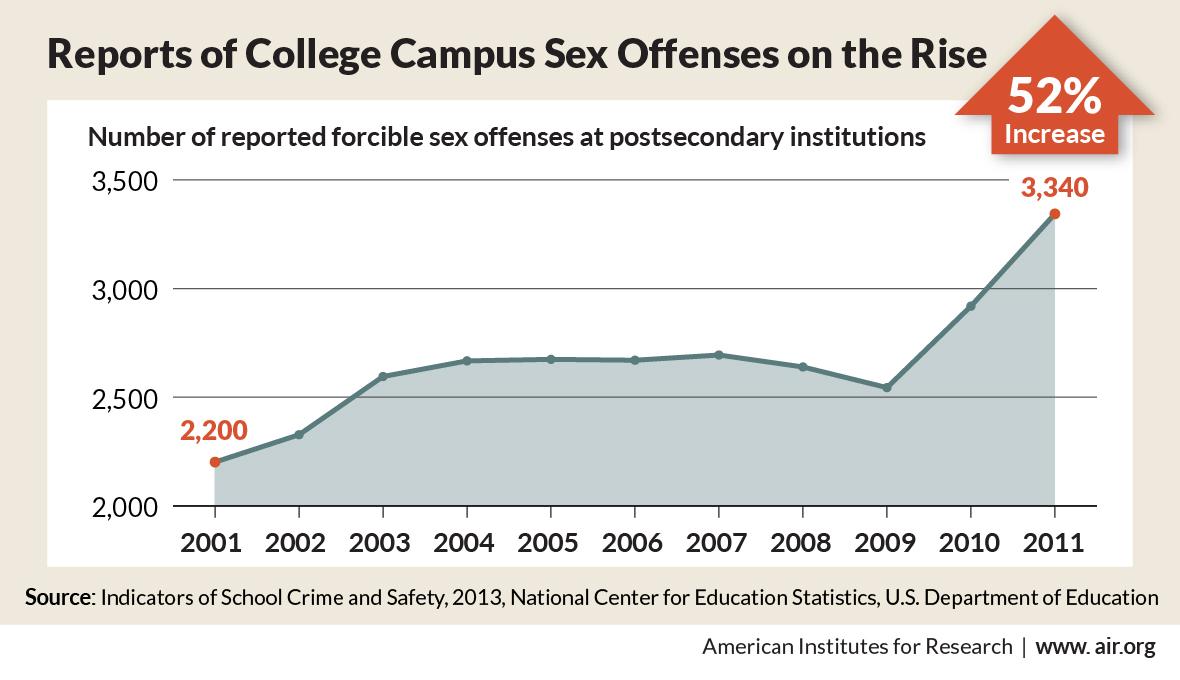
Sex Offenses on College Campuses
The 2013 report included a newly added section on criminal incidents at postsecondary institutions. Additional topics covered include student and teacher victimization; bullying and cyber-bullying; drugs and alcohol use; gun access; school security measures; security staff presence; and student perceptions of personal safety at school.
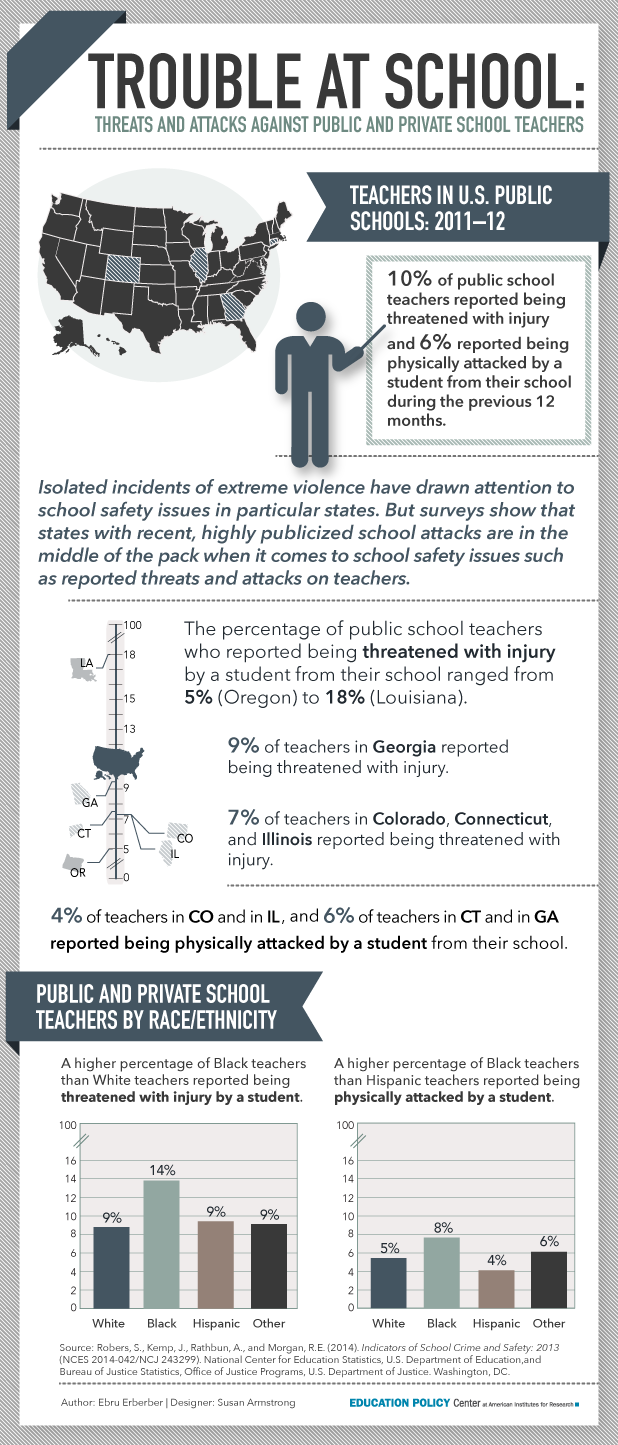
Threats and Violence Against Teachers
Reports